A while back when i asked people to think about how discovering a famine orphan in their family had affected them, I had no idea how rich and varied their response would be. The magnetism of Peter’s Ann Trainer, Brenda’s giving her Julia the dignity and protection she lacked in life, Kaye’s desire to know and understand her Bridget, are now joined by John’s mapping and IT creativity. I’m chuffed that he found something useful in my blog. Here’s John’s suggestions not just for his own orphan and the Earl Grey orphans generally but for all genealogists and family historians.
Part 2: A foray into Geographic Information Systems (GIS)
by John Moon
A GIS Approach (with a little bit of Genealogy)
In his #37 of 24 July 2016 our blog host, Trevor McClaughlin, asked the question “Can we create interactive digital maps?”
He continued, Let me demonstrate how this map business might work. Here is a map of the orphans in Queensland c. 1861. I’ve entered a few numbers. If we had an interactive map, what might appear if we clicked on numbers 1 and 2, at Ipswich?
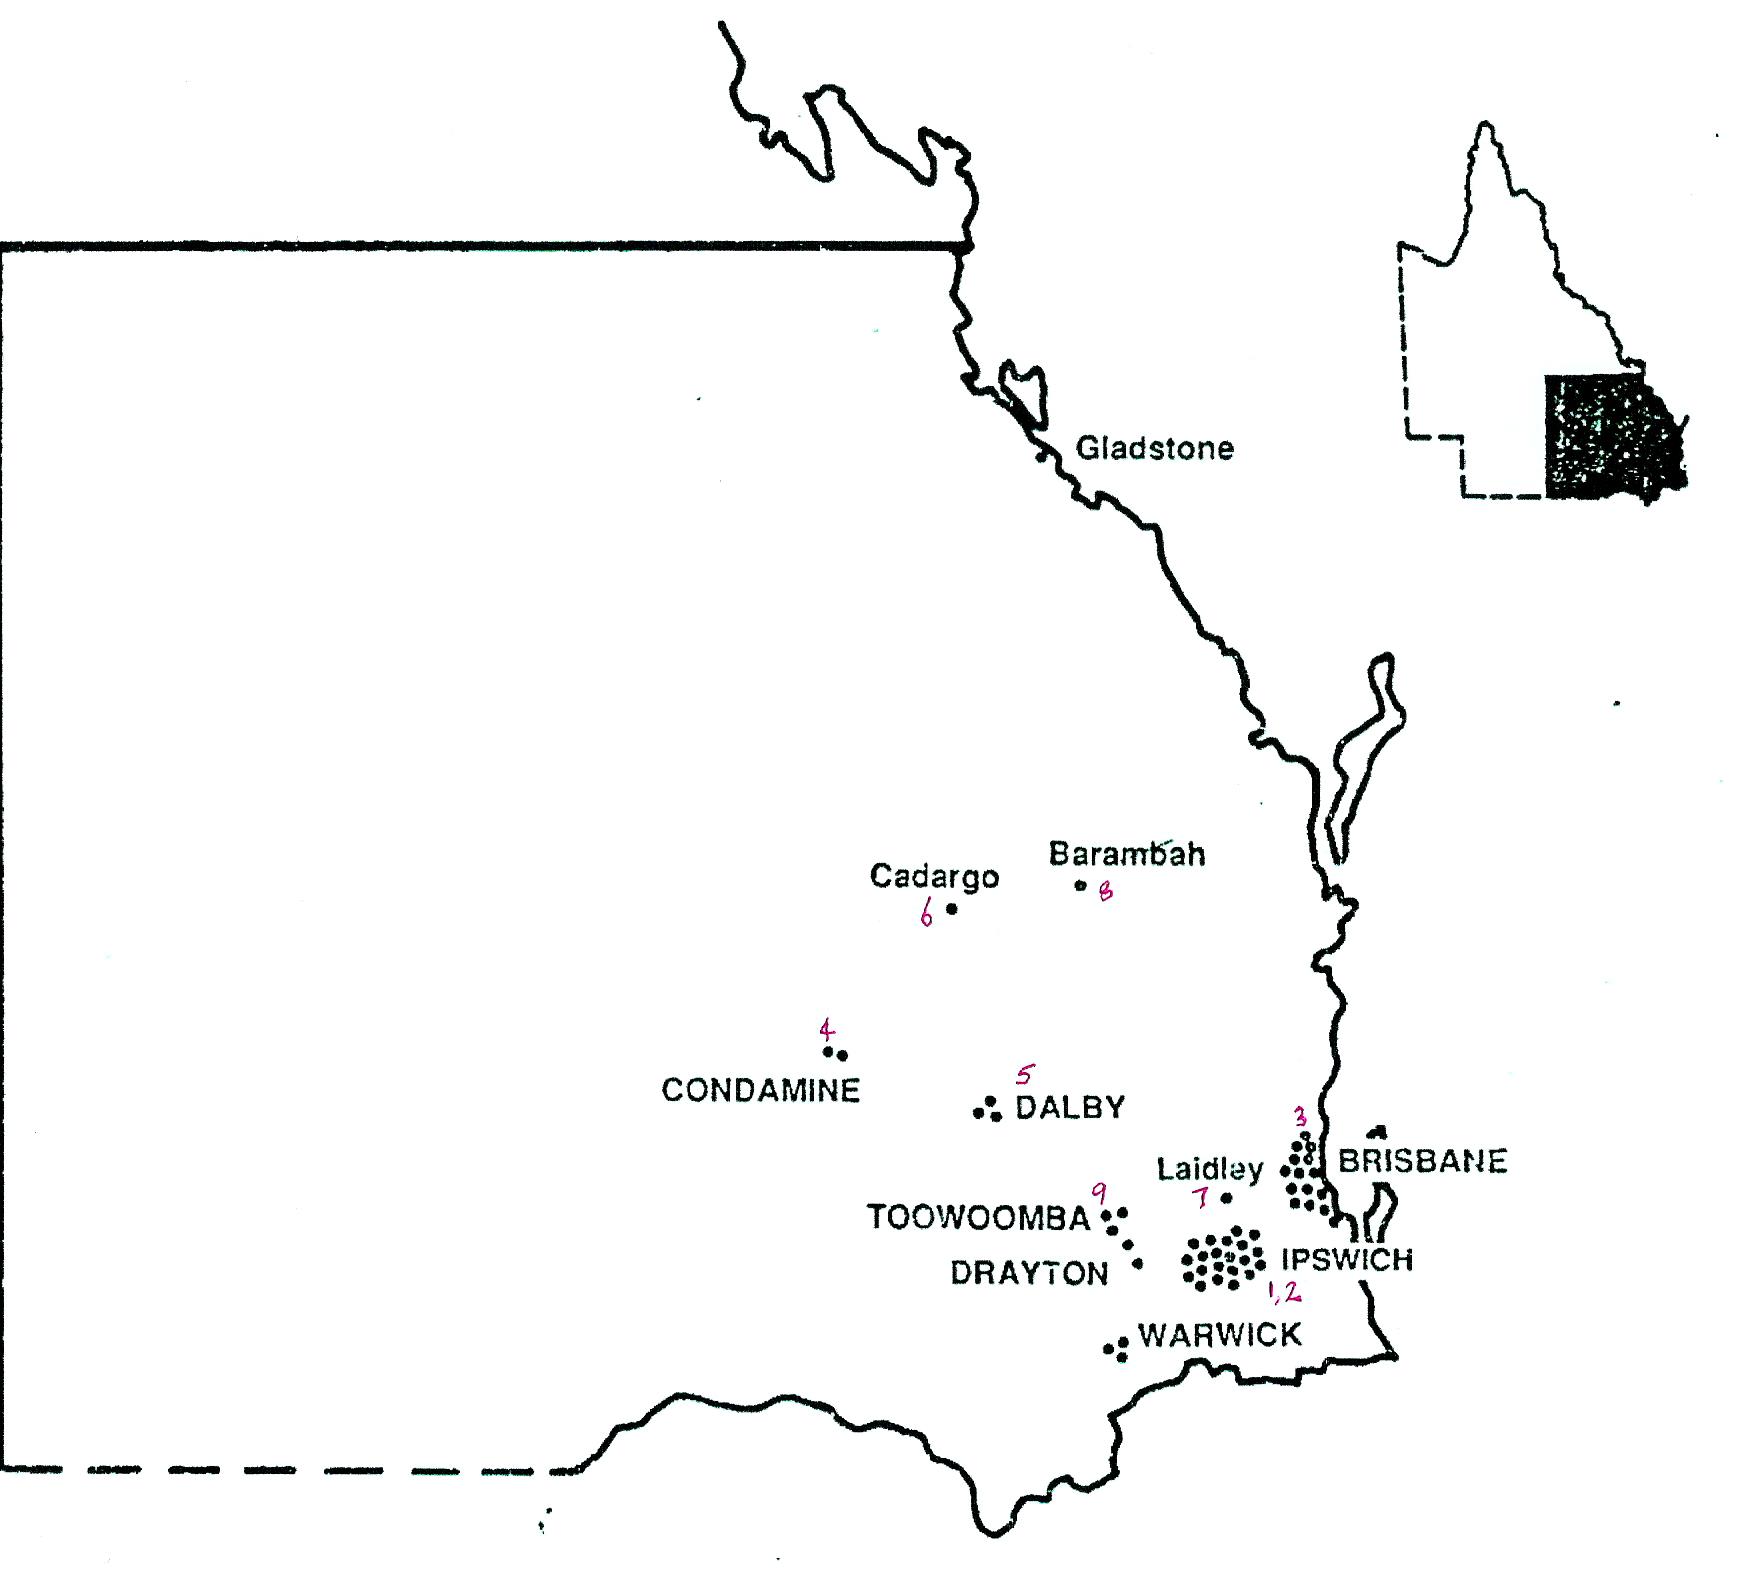
Could we do something …, such as clicking on the dots in the map to bring up all the information we have about the orphan who resided there at that particular time? Maybe there are some probate records? [or maybe a photograph?]
The short answer is “yes”, as is demonstrated in the following screen shots taken from an application of the free GIS software package QGIS for the nine orphans in Trevor’s example.


In earlier blog posts #12 and #17 Trevor asked further questions related to maps, “scattering” and “family reconstruction”.
<#12.> “In the last post <#11> I mentioned a possible use for completed family reconstitutions viz. maps showing the location of the orphans at particular times in their lives. Here’s a couple I used in Barefoot 2–the location of the orphans in Victoria in c.1861. This one is based on the birth records of their children. The second one is the location of the orphans in Victoria at the end of their lives c.1890-1901; this one is based on their death certificates.” In # 17 similar maps for Queensland and NSW were shown. Towards the end of this blog is Trevor’s map of the three states for 1861.
<#17> Under the title Orphan “scattering”, Trevor mentions that I’ve already mapped the origin of the orphans based on the workhouses they were from (see blogpost 4). Could maps be drawn which show their more precise origins in Ireland, as well as their place of first employment in Australia”, and makes the plea “Is there not a computer programme that would allow us to map their movements over time? We could follow them between places of employment, and through marriage, birth and death records for much of their life.
Again, the short answer is “yes”, as is demonstrated in the following screen shots taken from another application of QGIS. (In fact some of the above maps would be relatively easy to develop if the relevant data, including latitude and longitude of the towns, were available in an Excel spreadsheet. Although there may be a – solvable – problem of displaying an orphan’s details when more than one orphan has the same latitude and longitude).
The following map shows Jane Hutchinson’s movements (as discussed in part I of this blog), numbered 1-7, from her arrival at Melbourne to her death in Wangaratta. As a base map an old geofererenced Map of Victoria, including the Pastoral Runs has been used.

As with all “short answers” there is a “BUT”, in fact many buts.
Some of the “buts” relate to the following questions:
(a) “do you want to develop the map for your own use”?
In Trevor’s post 17 of 25 May 2015 he notes that Barbara Barclay has made excellent use of maps in her study of Famine orphans from County Mayo. (see <http://www.historicalballinrobe.com/page/the_mayo_orphen_gilrs?path=0p3p> http://mayoorphangirls.weebly.com/ ). In a comment on the post Barbara noted that I did my two simple maps with my basic grasp of ArcGIS. Any proficient user of GIS mapping software could easily produce the types of maps you suggest – given the data.
Barbara suggests that to answer this question there is a prerequisite of being a proficient user of GIS mapping software. Whilst not wishing to discourage anybody from using say QGIS (free) or ArcGIS (paid) there is a “learning curve” for them that can be steep. However, there are a lot of good YouTube tutorials available to help going up the curve.
(b) “do you want the map as part of a website (e.g. Trevor’s WordPress Site)”?
This is possible but has resource implications. These include the costs (monetary and person-power) of setting up and maintaining the data bases and software as well as those of hosting of a website.
Concerning WordPress Trevor, in a reply to a comment in blog #37 noted that wordpress.com is different from wordpress.org. The latter is where the map plugins are. (In other words, Trevor’s blog is on wordpress.com so the map plugins can’t be used).
(c) “do you want something inbetween (i.e. a map that is not connected to a website but be can displayed in your web browser).
Many GIS software packages have the facility to publish GIS data to “the web”. In QGIS, the plugin is QGIS2Web. Whilst I haven’t used it, I understand that it generates a set of files and folders that can be zipped and shared with others. Once unzipped, it has an index.html file which, when clicked, displays the map in your browser. This map has all the features included by the developer for example the ability to click on the dots in the map to bring up the information on an orphan.
A major advantage such an approach is that one does not need to be a “proficient user of GIS mapping software” to click on the dots in a web browser. Presumably one could have a link to the zip file in Trevor’s blog.
Whilst this approach makes it easier for the user it still has the person-power costs of setting up and maintaining the data base. I also suspect that the size of the zipped file may become quite large as the number of images of orphan’s information increases (if there was only text data associated with each orphan, then the zipped file size would probably be acceptable – one would have the same facility to click on dots however, it would only be text that is displayed).)
A Genealogical Approach (with a little bit of GIS)
In another blog (#11), Trevor mentions that “One of the research tools I used for the Earl Grey Famine orphans was a modified form of what demographers know as ‘family reconstitution‘.
Family reconstitution is the technique of linking records of demographic events, usually of an ecclesiastical nature, within and between individual lives, in order to recreate individual life histories and the histories of families. While genealogists have always pursued such linking, the intent of demographers is not simply to record chains of descent and marriage but rather to compile information on the demographic rates pertaining to the population of which the individuals and families were a part. E.A. Hammel, in International Encyclopedia of the Social & Behavioral Sciences, 2001. (Most social scientists invent new words for the old ways of doing things in an attempt to differentiate their “new” product.)
I pick-up Hammel’s phrase “genealogists have always pursued such linking” and ask myself whether a genealogical software package (with a – limited – GIS capability) may be a better alternative to a full-blown GIS package. Such an approach should in fact have a gentle learning curve as I presume that many readers of Trevor’s blog are familiar with genealogy websites such as Ancestry, My Heritage, Findmypast, Familysearch or WikiTree. I am however thinking of something like the free genealogy software package “Gramps”.
The following screenshots show the output of “Gramps” for Jane Hutchinson, her husband and their children (“family reconstitution” and “scattering”).
The first screenshot shows Jane’s movements from her arrival in Melbourne, employment in Merri Creek and Campaspe River, marriage in Melbourne and movements to Taminick and North Wangaratta. If one clicks on any of the pins a pop-up box appears with details of the events at that pin.
The second screenshot expands the movements to all of Jane’s family including the deaths of two of her children, one in Queensland and the other in New Zealand. Again, clicking on a pin gives details of the event at the location of the pin.
The third and fourth screenshot shows the pop-up box of events at Wangaratta and North Wangaratta.


Further, Gramps can produce various reports and charts and reports including family trees and fan charts as illustrated below.


So, returning to the question “Can we create interactive digital maps?”
As indicated above the answer is “yes”. However what we can display in the maps depends upon the data available. Further, the the development time of such maps depends upon the format in which the data is presented, the preferred format being electronic such as a spreadsheet or other readable database (hard copy printed data, in tabular form, can also be scanned and extracted then read into a database).
An example of a database is that at the Irish Famine Memorial which includes the fields: First Name, Surname, Native Place, Age on Arrival, Parents, Religion, Ship Name and Details (although there are some spelling issues for Surname and Native Place and it is not clear whether the Details field is a text field or a concatenation of other fields such as Employer, Marriage etc.).
Similarly, if the original data from which Trevor drew the maps frozen at specific points in time (1848-50, 1861 and c.1890-1900) for Barefoot vol.2 were available, then these data could be recombined with that at the Irish Famine Memorial to produce a set of general statistics such as age on arrival, age at first marriage, age at death, number of children etc.
They could also be used in a map to view questions such as:
Show me all the girls who arrived on <name of ship>
Show me who married a convict “exile”
Show me which girls were married in <church name>
Show me which girls came from <county or workhouse> in Ireland
Show me first employers and their location
“Family reconstitution”.

The “modified form of what demographers know as ‘family reconstitution‘” that Trevor used for his orphan data cards (see example below) can equally well be represented in a genealogical software package such as “Gramps”. The added advantage of such a package is that various charts and reports can be generated including family trees and fan charts as well as being able to follow the movements of orphans and their families.
Given that such packages are “user friendly”, perhaps their use could also encourage descendants of orphans to provide data on their “family reconstitution”.

John’s suggestions are inspirational. Have a look again at his paragraph just before the last map. A couple of nights ago, about 3am, I even found myself thinking about the possibilities. (It’s an age thing. No it’s not. I spent a lifetime, going through the next day’s teaching in my head during the night.)
One of the interactive digital maps that set me off in this direction some years ago was about the spread of North American railways. The Stanford university interactive map was captivating. I imagined the lives of the orphans could be displayed like that too. Look at the map above. Can you see how the discovery of gold in Victoria has affected where the orphans spread?
Maybe a simpler map to begin with is the way to go. Can we map the movement of the orphans during their lifetime? We have one of the workhouse origins of the orphans already. As John suggests, I’m sure we can also draw one representing where exactly they were first employed.
Kiss (keep it simple stupid). By happy circumstance my 1991 Barefoot & Pregnant? became part of the Untapped research project out of the University of Melbourne. One result of which is that all the books in the project are being republished by Booktopia. That hard copy should be easier to work with and be the means of identifying the Port Phillip orphans’ first employer. We can then place them on a map of Melbourne and its surrounds, or further afield.
To repeat what John suggested above, thereafter, using my family reconstitutions and the work of family historians, it may be possible to identify where the orphans were, at two or three year(?) intervals, via the birth registration of their children. There are drawbacks of course. How do we find where the married orphans went after their child-bearing years? Maybe their descendants via the Port Phillip Orphans FaceBook page would provide the necessary information? The other most important go-to place, and most up-to-date, is the Irishfaminememorial database.
You may wish to say, ‘Tell him he’s dreamin’.
A reminder, https://irishfaminememorial.org/invitation-to-attend-commemoration-ceremony/
